Google Analytics Data API を用いてGA4プロパティのカスタム ディメンションの値を取得する - C#
Google Analytics Data API を用いてGA4プロパティのカスタム ディメンションの値を取得するコードを紹介します。
概要
Google Analytics 4 ディメンションにカスタムディメンションを設定しての値を取得する場合は、
Dimensionsプロパティに
customEvent:(カスタム ディメンション名) customUser:(カスタム ディメンション名) を指定します。
指定したカスタムディメンションの値のみを取得する場合には、ディメンションフィルタで特定のカスタムディメンションの値のみを取得する方法もあります。
ディメンションフィルタを設定しての値を取得する場合は、
DimensionFilterプロパティを設定します。
書式
カスタム ディメンションの範囲(スコープ)が "イベント" の場合
customEvent:(カスタム ディメンション名)
カスタム ディメンションの範囲(スコープ)が "ユーザー" の場合
customUser:(カスタム ディメンション名)
ディメンションにカスタムディメンションを指定する場合
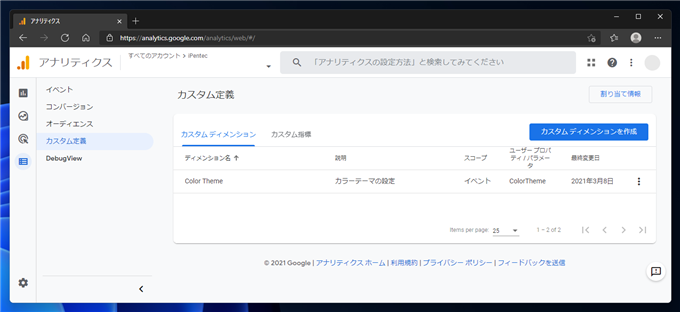
Google Analyticsの設定
Google Analytics v4プロパティを作成します。設定画面の[カスタム定義]のカスタム ディメンションにカスタム ディメンションを作成します。
今回作成したカスタム ディメンションはスコープを"イベント"に設定しています。
カスタム ディメンションを利用したトラッキングコードをWebページに実装します。詳細については
こちらの記事を参照してください。
事前準備
Google Analytics Data APIを有効にし、認証のためのキーファイルなどを取得します。
手順の詳細は
こちらの記事を参照してください。
プログラム
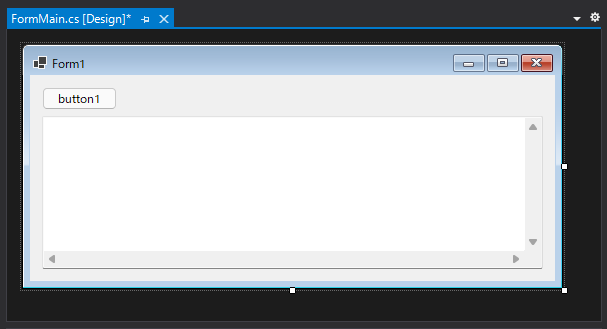
Windows Formアプリケーションを作成します。
UI
下図のフォームを作成します。
コード
以下のコードを記述します。
using System;
using System.Collections.Generic;
using System.ComponentModel;
using System.Data;
using System.Drawing;
using System.Linq;
using System.Text;
using System.Threading.Tasks;
using System.Windows.Forms;
using System.Windows.Forms;
using Google.Analytics.Data.V1Beta;
using Google.Api.Gax;

namespace GoogleAnalyticsDataApiCustomDimension
{
  public partial class FormMain : Form
  {
    public FormMain()
    {
      InitializeComponent();
    }

    private void button1_Click(object sender, EventArgs e)
    {
      BetaAnalyticsDataClient aadc = new BetaAnalyticsDataClientBuilder()
      {
        CredentialsPath = "(JSON形式キーファイルのパス)"
      }.Build();

      RunReportRequest request = new RunReportRequest()
      {
        Property = "properties/9876543210",
        Dimensions = {new Dimension() { Name = "customEvent:ColorTheme" } },
        Metrics = { new Metric() { Name = "activeUsers" } },
        DateRanges = { new DateRange() { StartDate = "2021-06-01", EndDate = "2021-06-10" } }
      };

      RunReportResponse response = aadc.RunReport(request);

      foreach (Row r in response.Rows) {
        textBox1.Text += string.Format("{0}, {1}\r\n", r.DimensionValues[0].Value, r.MetricValues[0].Value);
      }
    }
  }
}
解説
Google Analytics Data APIの認証やBetaAnalyticsDataClient の作成については
こちらの記事を参照してください。
RunReportRequestオブジェクトを作成します。オブジェクト作成後、Propertyプロパティに
properties/(アクセスするGoogle Analytics V4 プロパティのID) を設定します。
Dimensions には取得するディメンションを設定します。今回はカスタムディメンション別の値を取得するため、Name = "customEvent:ColorTheme" を指定しています。
また、Metricsに取得する値を設定します。今回は
activeUsers を設定し利用者数を取得します。DateRangesには取得する日時の範囲を指定します。
  RunReportRequest request = new RunReportRequest()
  {
    Property = "properties/9876543210",
    Dimensions = {new Dimension() { Name = "customEvent:ColorTheme" } },
    Metrics = { new Metric() { Name = "activeUsers" } },
    DateRanges = { new DateRange() { StartDate = "2021-06-01", EndDate = "2021-06-10" } }
  };
RunReportメソッドを実行しレポートのデータを取得します。取得したデータをテキストボックスに表示します。
  RunReportResponse response = aadc.RunReport(request);

  foreach (Row r in response.Rows) {
    textBox1.Text += string.Format("{0}, {1}\r\n", r.DimensionValues[0].Value, r.MetricValues[0].Value);
  }
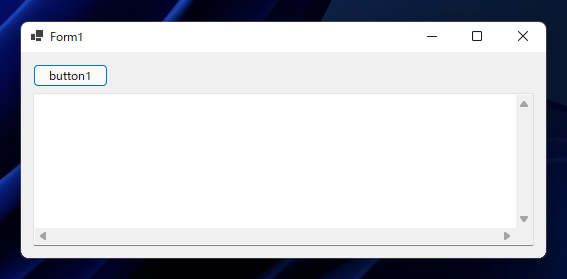
実行結果
プロジェクトを実行します。下図のフォームが表示されます。
[button1]をクリックします。データが取得され、カスタム ディメンションの値ごとの利用者数がテキストボックスに表示されます。
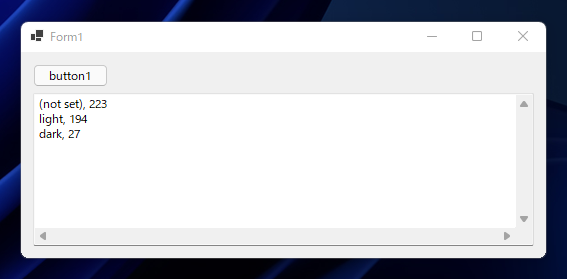
C#のプログラムから、カスタム ディメンションごとの値を取得できました。
プログラム : 複数のディメンションを設定した場合
複数のディメンションを設定した場合の取得データを確認します。
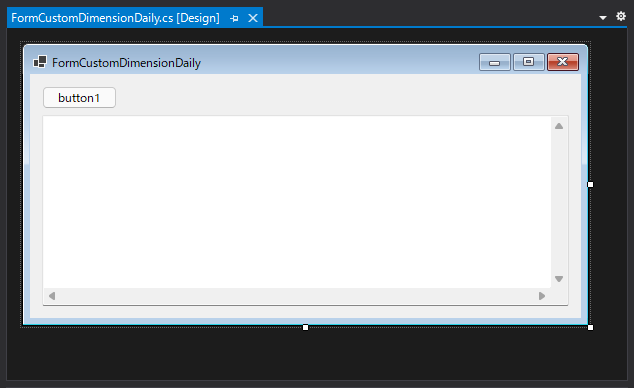
UI
下図のフォームを作成します。
コード
using System;
using System.Collections.Generic;
using System.ComponentModel;
using System.Data;
using System.Drawing;
using System.Linq;
using System.Text;
using System.Threading.Tasks;
using System.Windows.Forms;
using Google.Analytics.Data.V1Beta;

namespace GoogleAnalyticsDataApiCustomDimension
{
  public partial class FormCustomDimensionDaily : Form
  {
    public FormCustomDimensionDaily()
    {
      InitializeComponent();
    }

    private void button1_Click(object sender, EventArgs e)
    {
      BetaAnalyticsDataClient aadc = new BetaAnalyticsDataClientBuilder()
      {
        CredentialsPath = "ipentectest-47441b548b72.json"
      }.Build();

      RunReportRequest request = new RunReportRequest()
      {
        Property = "properties/(プロパティのID)",
        Dimensions = { new Dimension() { Name = "Date" }, new Dimension() { Name = "customEvent:ColorTheme" } },

        Metrics = { new Metric() { Name = "activeUsers" } },
        DateRanges = { new DateRange() { StartDate = "2021-07-01", EndDate = "2021-07-05" } }
      };

      RunReportResponse response = aadc.RunReport(request);

      foreach (Row r in response.Rows) {
        textBox1.Text += string.Format("{0}, {1}, {2}\r\n", r.DimensionValues[0].Value, r.DimensionValues[1].Value, r.MetricValues[0].Value);
      }
    }
  }
}
実行結果
プロジェクトを実行します。下図のウィンドウが表示されます。
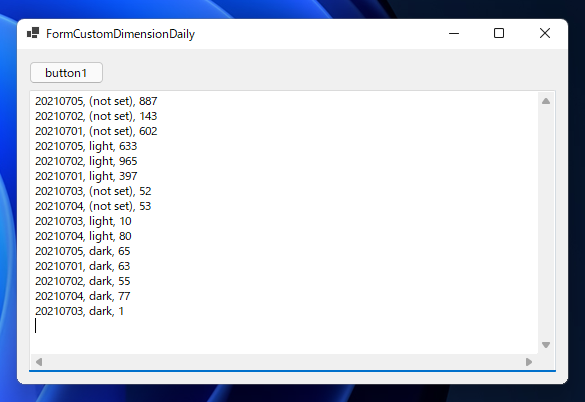
[button1]ボタンをクリックします。テキストボックスに結果が出力されます。
response.Rows[n].DimensionValues[0] に最初のディメンションである日付の値が表示され、
response.Rows[n].DimensionValues[1] にカスタムディメンションの値が表示されます。
response.Rows[n].MetricValues[0] に日付、カスタムディメンションの値に対応したアクティブユーザー数が表示されます。
ディメンション フィルタで特定のカスタムディメンションの値に絞り込む場合
プログラム例
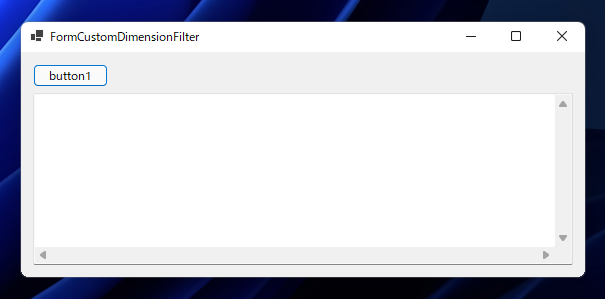
UI
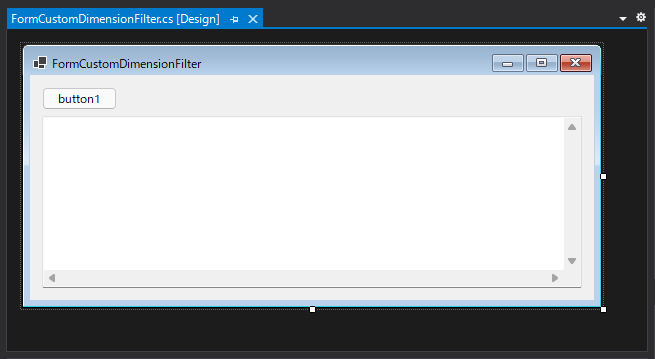
下図のフォームを作成します。ボタンとテキストボックスを配置します。
コード
using System;
using System.Collections.Generic;
using System.ComponentModel;
using System.Data;
using System.Drawing;
using System.Linq;
using System.Text;
using System.Threading.Tasks;
using System.Windows.Forms;
using System.Windows.Forms;
using Google.Analytics.Data.V1Beta;

namespace GoogleAnalyticsDataApiCustomDimension
{
  public partial class FormCustomDimensionFilter : Form
  {
    public FormCustomDimensionFilter()
    {
      InitializeComponent();
    }

    private void button1_Click(object sender, EventArgs e)
    {
      BetaAnalyticsDataClient aadc = new BetaAnalyticsDataClientBuilder()
      {
        CredentialsPath = "(JSON形式キーファイルのパス)"
      }.Build();

      RunReportRequest request = new RunReportRequest()
      {
        Property = "properties/(プロパティID)",
        Dimensions = { new Dimension() { Name = "Date" } },

        DimensionFilter = new FilterExpression()
        {
          Filter = new Filter()
          {
            FieldName = "customEvent:ColorTheme",
            StringFilter= new Filter.Types.StringFilter() { Value="dark"}
          }
        },

        Metrics = { new Metric() { Name = "activeUsers" } },
        DateRanges = { new DateRange() { StartDate = "2021-07-01", EndDate = "2021-07-05" } },
        OrderBys = { new OrderBy() {
          Dimension = new OrderBy.Types.DimensionOrderBy() {
            DimensionName = "Date"
          }
        }}
      };

      RunReportResponse response = aadc.RunReport(request);

      foreach (Row r in response.Rows) {
        textBox1.Text += string.Format("{0}, {1}\r\n", r.DimensionValues[0].Value, r.MetricValues[0].Value);
      }
    }
  }
}
解説
Google Analytics Data APIの認証やBetaAnalyticsDataClient の作成については
こちらの記事を参照してください。
ディメンションフィルタのコードは下記になります。
DimensionFilterプロパティに、FileExpressionオブジェクトを作成して代入します。
FileExpressionオブジェクト内のFilterプロパティに新しいFilterオブジェクトを作成して割り当てます。Filterオブジェクト内のFieldNameプロパティにフィルタする対象のカスタムディメンションの
名称を設定します。
StringFilter プロパティにフィルタする値を設定します。今回の例では、ColorTheme カスタムディメンションの値が "dark" のみを表示するため、StringFilter の Value プロパティに "dark" を設定しています。
  DimensionFilter = new FilterExpression()
  {
    Filter = new Filter()
    {
      FieldName = "customEvent:ColorTheme",
      StringFilter= new Filter.Types.StringFilter() { Value="dark"}
    }
  },
下記の
OrderBysプロパティではデータの表示順を設定しています。今回は、OrderByオブジェクトを1つ作成し、Dimension プロパティに Date を指定し日付順のみで
ソートする動作を設定しています。
  OrderBys = { new OrderBy() {
    Dimension = new OrderBy.Types.DimensionOrderBy() {
      DimensionName = "Date"
    }
  }}
実行結果
上記のプロジェクトを実行します。下図のウィンドウが表示されます。
[button1]をクリックします。下部のテキストボックスに結果が表示されます。
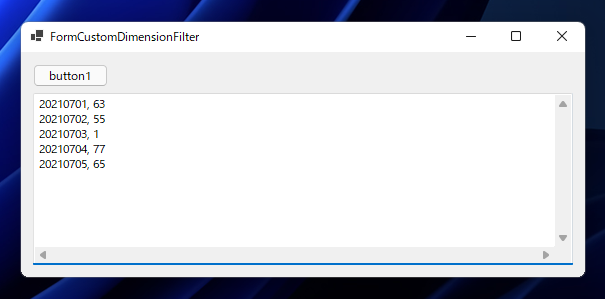
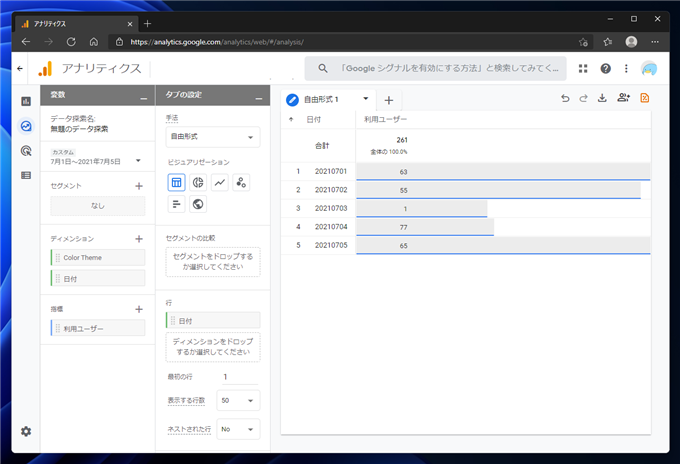
Google Analytics v4 レポート画面で同様の指標の数値を表示します。C#プログラムの出力と同じ値が出力できており、正しく値が取得できていることが確認できます。
カスタムディメンションでフィルタした値を取得できました。
著者
iPentecのメインプログラマー
C#, ASP.NET の開発がメイン、少し前まではDelphiを愛用


